 In Development
Geospatial Analytics / Sustainability
Solar Waste Forecasting Dashboard
An interactive spatial platform exploring photovoltaic installation trends and potential future solar panel waste patterns.
Remote sensing / Urban climate
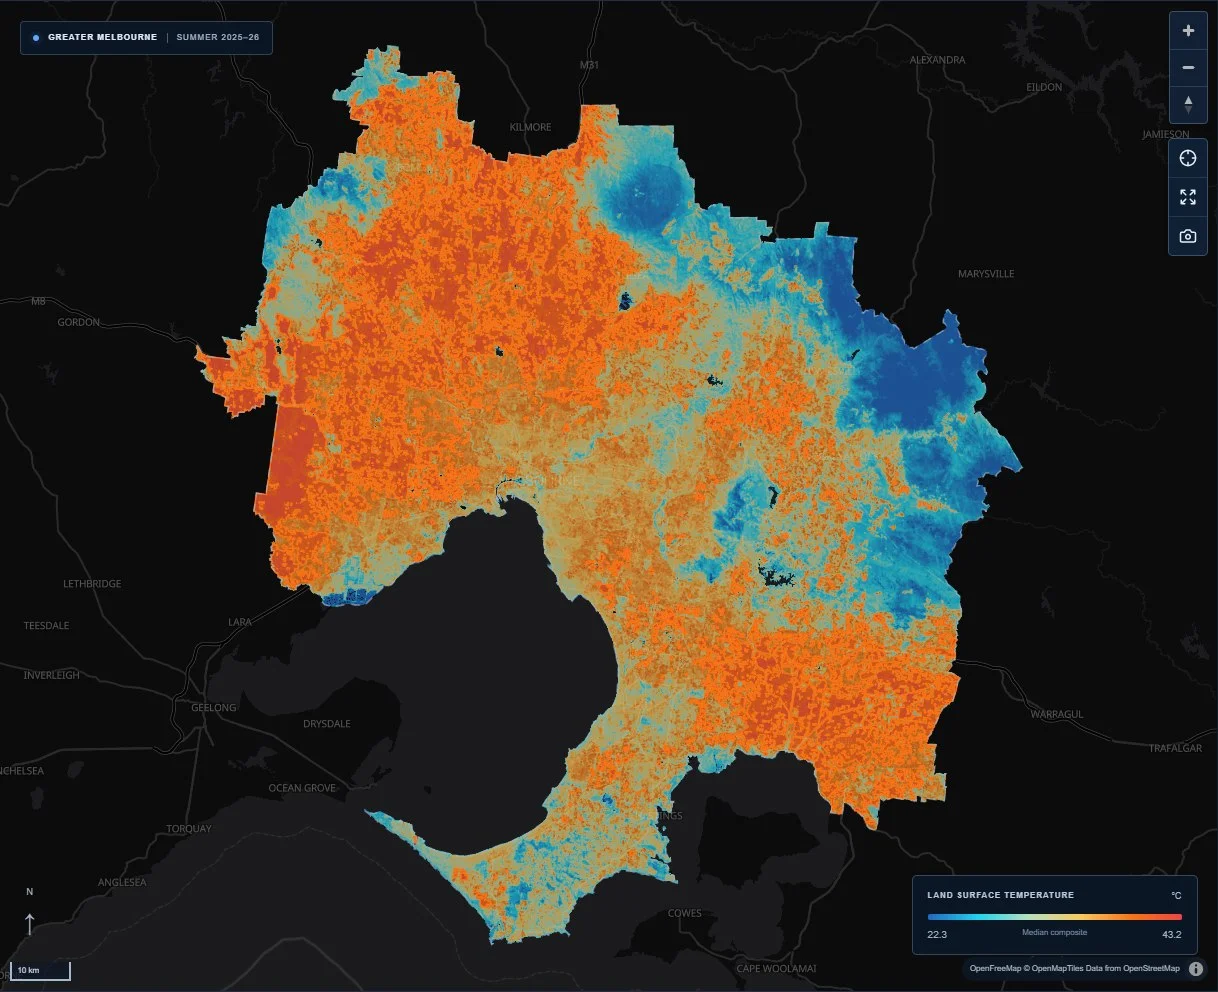
Created for 30DayMapChallenge 2026, Day 4 — Clusters, this explorer connects processed Landsat 8 and 9 observations with an interactive Greater Melbourne map. The analysis uses a quality-masked seasonal composite for 1 December 2025 to 28 February 2026. Visitors can compare land surface temperature and vegetation layers, inspect contiguous heat clusters, filter by cluster area and explore charts linking surface heat with NDVI.
Make satellite-derived surface patterns legible while preserving the dates, uncertainty and distinction between land surface and air temperature.
Prepare quality-masked seasonal Landsat composites, group connected warm and cool cells, and present temperature, vegetation and cluster attributes through interactive maps and analytical charts.
In DevelopmentGeospatial Analytics / Sustainability
An interactive spatial platform exploring photovoltaic installation trends and potential future solar panel waste patterns.
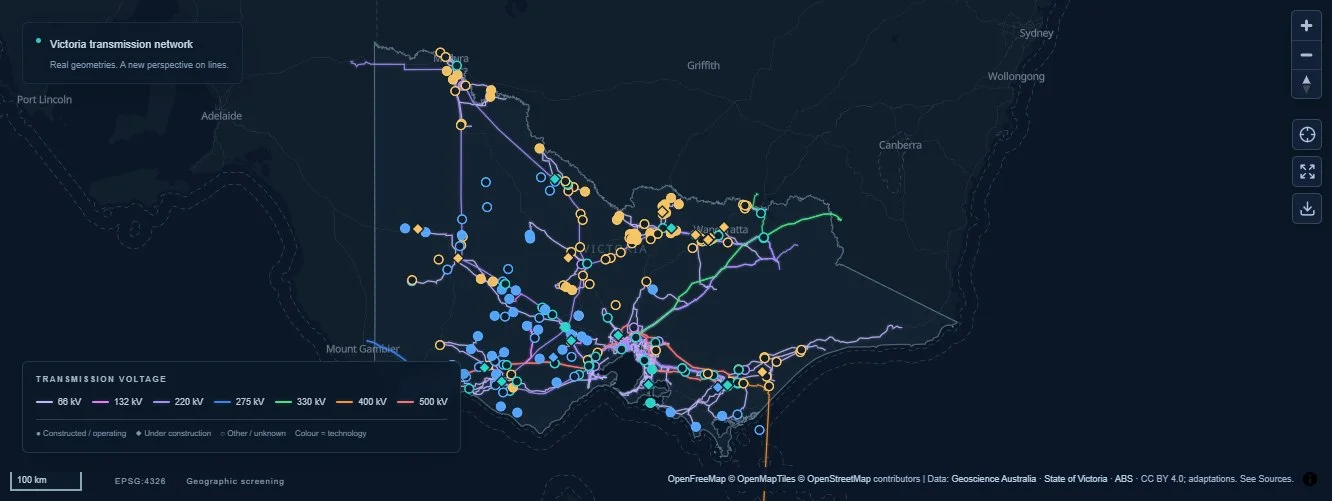 Live infrastructure explorer
Energy / Spatial analysis
An interactive dashboard exploring Victoria’s electricity network, renewable energy and battery storage sites through spatial proximity analysis.